Approximately 8% (103) of games during the 2017-2018 season were decided in the shootout. That season the three best teams in the shootout were Detroit, Edmonton, and St. Louis who all went on to miss the playoffs. However, playoff positioning was still impacted by shootout wins and losses. Toronto finished with 105 points with a shootout record of 7-2 while Philadelphia had a shootout record of 2-7 and finished with 98 points. Added differences in shootout wins can meaningfully impact the standings at the end of the season.
Past research into the shootout has covered a variety of topics from the financial implications to the impact of player talent on shootout results.
Seppa (2009) discussed the impact of shootout results in determining whether teams make the playoffs or not. Lopez and Schuckers (2016) went further to analyze the financial implications given shootout success and found that the best shooters and goalies were worth more than $500,000 per year based on shootout performance.
McEwan, Ginis, and Bray (2012) posited that there is a home advantage in loss-imminent situations, but a home disadvantage in win-imminent situations. However, Lopez and Schuckers (2016) did not find evidence of player performance variance under pressure after accounting for player talent. Hoffmann et al. (2016) found that the higher quality home teams' odds of winning decreased when the game went to a shootout compared to regulation.
Hawerchuk (2009) found that shootouts are shorter than would be expected. Hurley (2008) analyzed the probability of observing shootouts of various lengths.
Schuckers and Nelson found that there was not a statistically significant impact on the outcome of the game based on who went first in the shootout.
Much early shootout research has considered whether the shootout is a ‘crapshoot’. Hawerchuk (2009) looked into whether past performance could be predictive of future performance, but found that the sample size was too small to determine. Schuckers (2010) found that from the players selected for the shootout, assuming they are selected because they are among the best on their team, there is not enough data to say if any players are better than the others. Tulsky (2012) affirms the problem in determining shootout talent is the sample size.
Lopez and Schuckers (2016) concluded that shootouts are not inherently random and that there are small, but statistically significant talent gaps between shooters, but few “predictors of player success after accounting for individual talent.”
While most past research demonstrated that the sample size per player was too small to be predictive of their future success, is it possible that there are repeatable actions that consistently lead to shootout success? Most players consistently switch up their shootout strategy to varying degrees of success, thus considering the individual actions of each shot may have more predictive power than considering the success of each shooter.
In order to determine if there were repeatable actions that led to shootout success, I tracked every shootout attempt from the 2017-2018 season. By doing this, I could consider the success of shootout attempts by how they were executed and not by who. This also helps to consider the variety in player shot attempts; Artemi Panarin rarely does the same shootout move, but still scored on six of his ten attempts.
I tracked shooter location at the time of the shot, where the shot was aimed, the amount of time from when the shooter picked up the puck until when they shot, the amount of puck handling they did from forehand to backhand, and the shooter’s east-west movement.
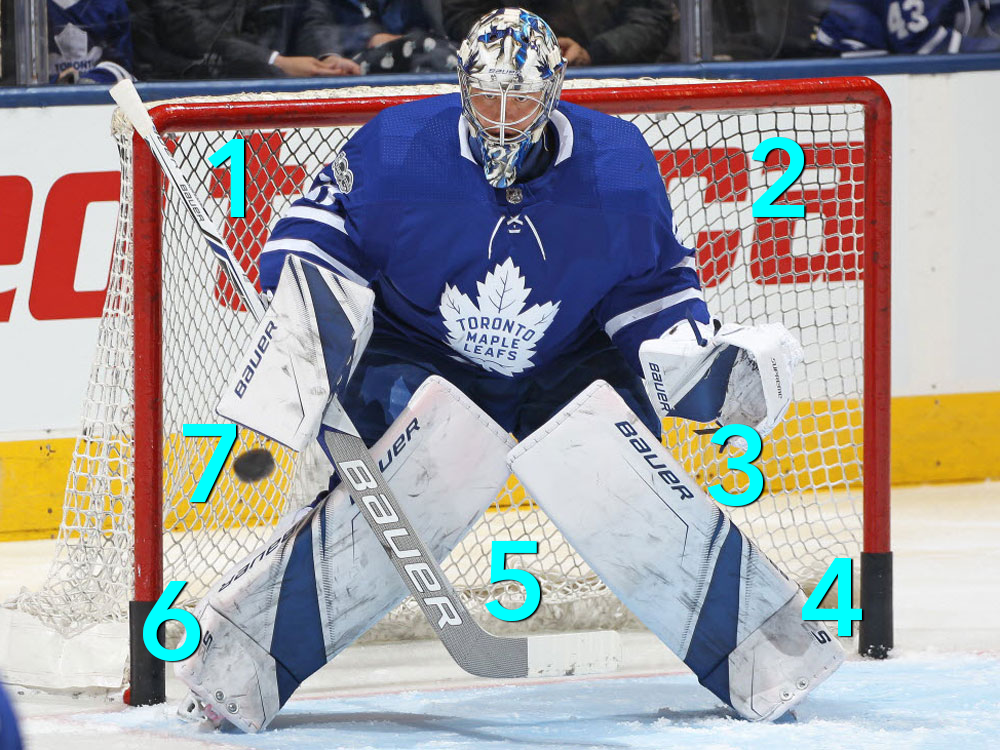
These were the general aim categories I tracked. Zones 4 and 6 covered pucks along the ice while 3 and 7 were for pucks that went above the pads.
I ended up tracking 783 shots which included 242 goals, 384 saves, and 157 misses. (Two shots from a game between Montreal and Buffalo on October 5, 2017 were not tracked because the footage I had access to did not include them).
Using all of these factors, I ran a binomial logistic regression to determine if any factors were statistically significant in scoring a goal. Factors considered were shot location, goalie aggressiveness, shot number in the shootout, goalie handedness, whether the shot was win or loss imminent, whether the player was at home or away, a player’s shot number for the season, player handedness, duration of the shot, number of times the player changed zones east to west, puck handling based on the number of times the player switched from forehand to backhand, shot type, and goal aim location.
The shot aim location, whether the player was at home or away, and the location of the player when shooting were statistically significant in determining whether a player scored or not.
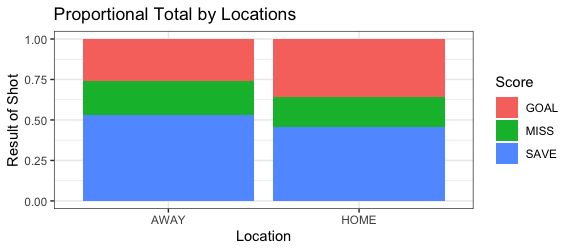
In the 2017-2018 season, more goals were scored by players that were at home than those that were away. This runs counter to some past research which has not found a consistent statistically significant impact in home ice advantage. However, this could easily be a single season anomaly; more data is required to see if this is a new trend that remains significant.
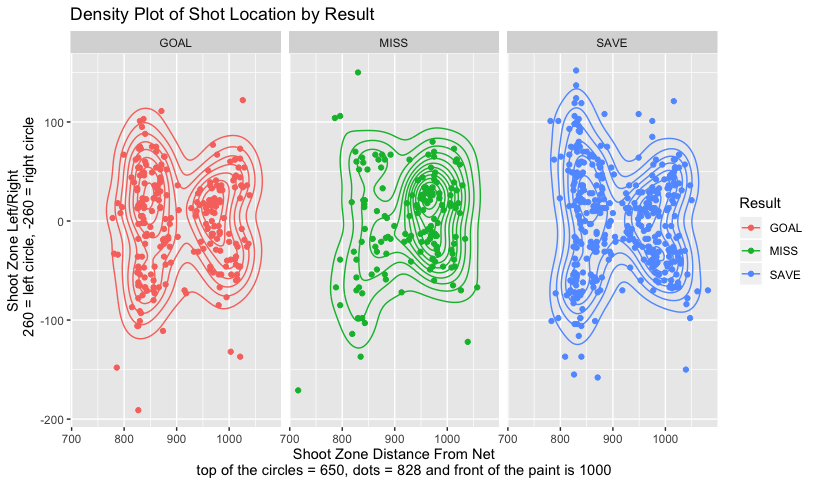
The above plot demonstrates the shot location split up by the result. The x-axis denotes the distance from the net with 1000 being the front of the paint. On the y-axis, the area from 100 to -100 is the inner slot between the two circles. Players who shot from outside of the slot were less likely to score a goal.
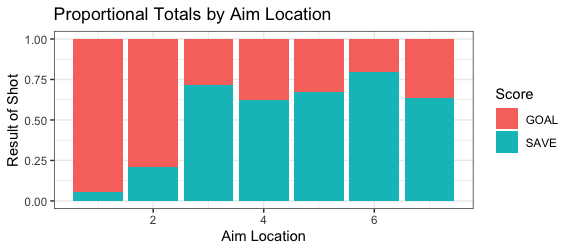
By viewing shot results by where the player aimed proportionally, shots aimed in the top left and right corner clearly had a higher success rate than all other shooting locations.
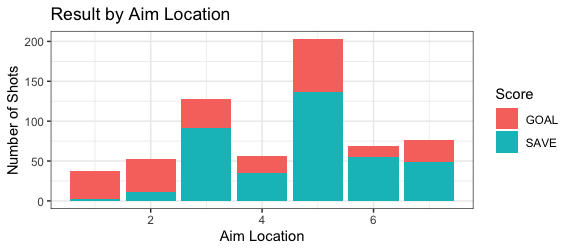
Comparing the proportional totals to the counting totals demonstrates how comparatively few players aim for the top corners and are stopped. Shots aimed five-hole resulted in the most goals, but also had the most attempts by far. If more shooters aimed for the top corner, it would be interesting to see if the scoring rate held up. The one caveat with this is missed shots. When players missed, I was unable to assume where they meant to aim. In future projects, I would consider making note of the general vicinity where players missed i.e. high or low to see how the missed high shots compare to the amount that players score in the top corners.
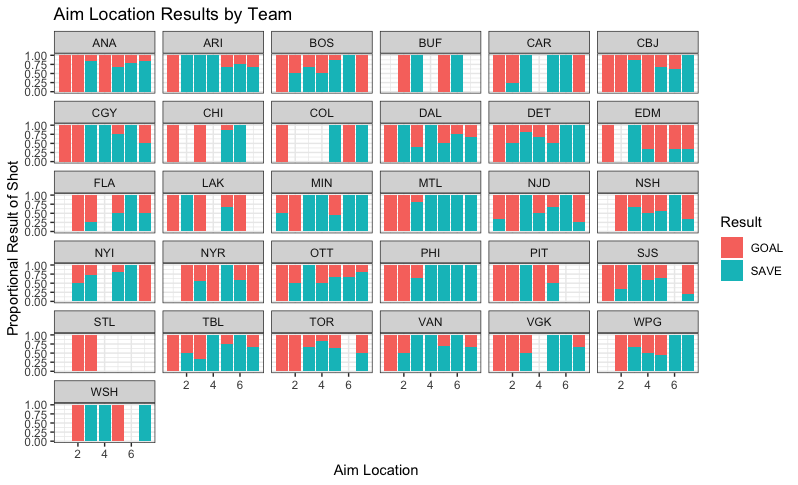
The prior results held true for nearly all teams. Other fluctuations are likely due to the small sample size across some of the teams.
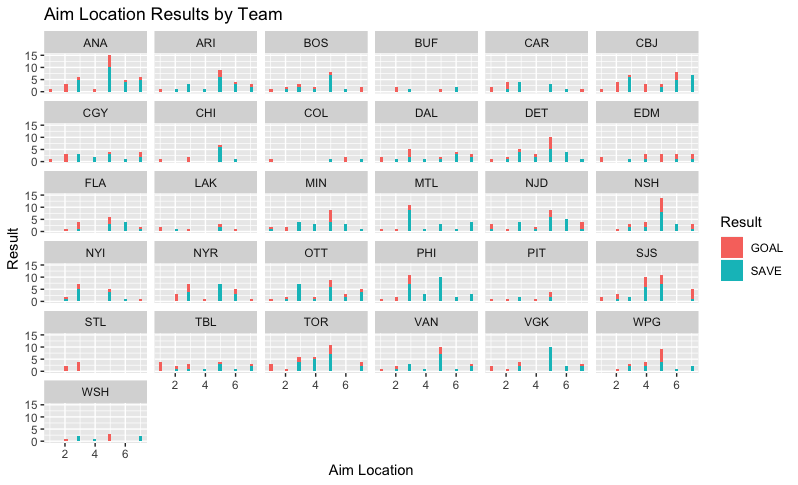
To emphasize how small some of the sample sizes were, I also plotted results by aim location by each team non-proportionally.
An increase in sample size is one way that this research could be further explored and validated. As noted above, if I replicated the project again, I would also track the general placement of missed shots i.e. high right, mid left, etc. I would also be interested in further analysis of how the goalie movement prior to the shot impacted the shooter. Some goalies were much more aggressive while others stayed in the crease. Without consistent camera angles, it wasn’t feasible to track this at this point in time. While there has been a significant amount of research into the shootout, given its importance in impacting playoff standings, there is still work to be done to investigate if there are paths to more frequent success.
To summarize, after running a binomial logistic regression on the data, several factors were statistically significant in shootout success: aim location, whether a player was at home or away, and shot location. The shot location and aim location data could be used to better strategize for success during the shootout and consequently, potentially impact team standings. Adopting specific strategies could lead to greater shootout success.
Acknowledgements
This project was completed as part of the Hockey Graphs Mentorship Program. Thank you to Michael Schuckers for his guidance with this project.
Sources
Hawerchuk. (2009). Shootouts: Does past performance mean anything?. Arctic Ice Hockey. https://www.arcticicehockey.com/2009/10/19/1089029/shootouts-does-past-performance
Hawerchuk. (2009). Shootouts: Goaltender True Talent. Arctic Ice Hockey. https://www.arcticicehockey.com/2009/10/20/1089388/shootouts-goaltender-true-talent
Hawerchuk. (2009). Shootout Length: Model vs Actual. Behind the Net. http://behindthenet.ca/blog/2009/03/shootout-length-model-vs-actual.html
Hoffmann, M. et al. (2017). Examining the home advantage in the National Hockey League: Comparisons among regulation, overtime, and the shootout. Psychology of Sport and Exercise. https://www.researchgate.net/publication/308598549
Hurley, W.J. (2008). On the Length of NHL Shootouts. Journal of Modern Applied Statistical Methods. https://digitalcommons.wayne.edu/cgi/viewcontent.cgi?article=1442&context=jmasm
Lopez, M. and Schuckers, M. (2016). Predicting coin flips: using resampling and hierarchical models to help untangle the NHL’s shoot-out. Journal of Sports Sciences. https://www.tandfonline.com/doi/abs/10.1080/02640414.2016.1198046?journalCode=rjsp20
McEwan, D. et al. (2012). “With the Game on His Stick”: The home (dis)advantage in National Hockey League shootouts. Psychology of Sport and Exercise. https://www.researchgate.net/publication/257591972
Schuckers, M. (2010). NHL Shootout is a Crapshoot. Arctic Ice Hockey. https://www.arcticicehockey.com/2010/12/29/1901842/nhl-shootout-is-a-crapshoot
Schuckers, M. and Nelson, Z. Impact of Going First on Winning an NHL Shootout. Statistical Sports Consulting.
Seepa, T. (2009). Inside the VUKOTA Projects. Hockey Prospectus.
Tulsky, E. (2012). Is the Shootout Really a Crapshoot?. Broadstreet Hockey. https://www.broadstreethockey.com/2012/2/13/2789709/yes-it-is/comment/91710439